
It is a Thursday, you are across from a prospective buyer or a carrier rep, and they ask the one question you should answer in your sleep: “What’s your retention?” You say “high eighties, I think,” and it lands as a guess, because it is one. You know your premium written to the dollar. But the single number that decides whether your book grows or quietly leaks, you are rounding from memory.
Here is the answer up front. There is no one retention rate. There are three, they rarely agree, and most agencies quote whichever their software spits out without knowing which. Policy-count retention tells you how many customers stayed. Premium (dollar) retention tells you how much money stayed, and in a hard market it can climb past 100 percent while you lose clients. Household or PIF retention tells you whether cross-sell is holding. Each one is a spreadsheet formula you can run in about fifteen minutes, and this post gives you all three plus the 2026 benchmarks to judge them against.
This is general business education, not legal, tax, or accounting advice. Pull your own numbers from your agency management system and confirm anything that affects a valuation or a carrier agreement with your own advisors before you act on it.
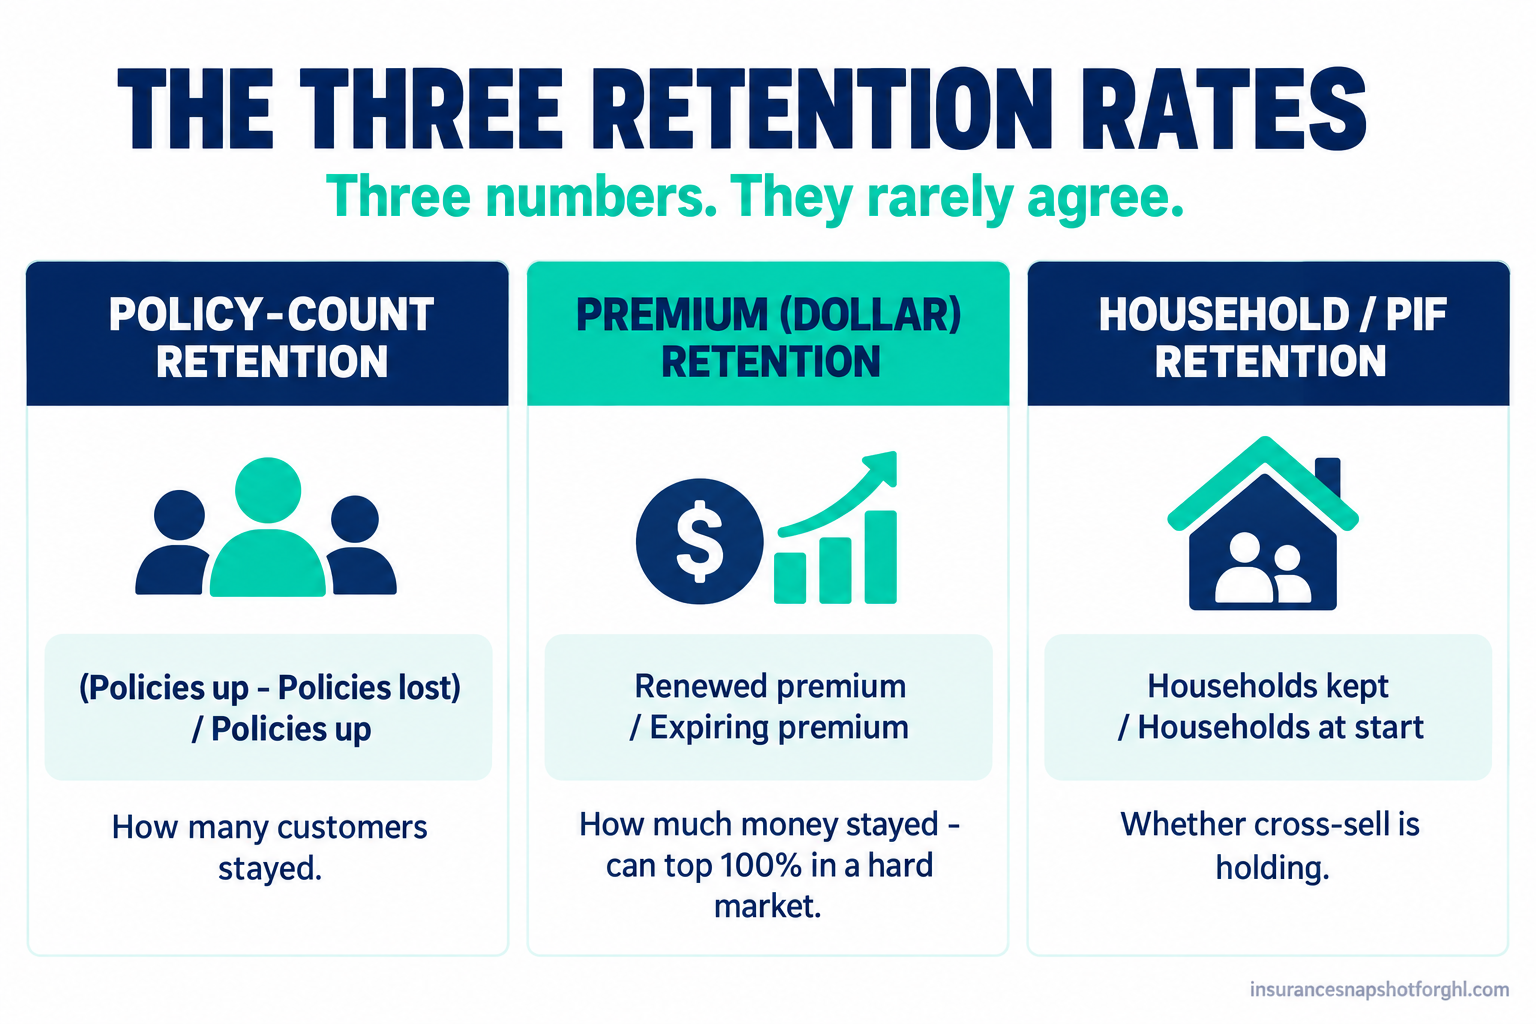
Table of contents
- The number almost no owner can say
- What a slipping rate costs you
- The three rates, and why they disagree
- Calculating policy-count retention
- Calculating premium (dollar) retention
- Calculating household and PIF retention
- The 15-minute retention worksheet
- The 2026 benchmarks
- Solo, five-producer, and larger
- Where it touches compliance
- Objections
- What to do with the number
- FAQ
The number almost no owner can say out loud
Ask a room of principals for last quarter’s new-business premium and hands go up fast. Ask for retention by line and the room goes quiet. That is backwards, because retention is the bigger lever. Independent agents placed 61.5 percent of all U.S. property and casualty premium written in 2024 (Big “I” via Insurance Journal), so the channel is not short on premium. The shops that struggle leak renewals out the back while pouring leads in the front.
Liberty Mutual’s 2026 Independent Agency Growth Study, run through its Agent for the Future program, surveyed nearly 1,200 agency principals and staff. It found 98 percent say retention is very important to agency success, ahead of every other priority, yet only 18 percent reported retention improving by 5 percent or more in the past year (IA Magazine). Almost everyone agrees it matters. Almost no one moves it, because you cannot improve a number you do not measure, or measure one you cannot define.
What a slipping retention rate actually costs you
An insurance book is a subscription business in disguise. Every renewal is a repurchase decision. A client who renews costs almost nothing to keep and pays commission again for years. A client you lose has to be replaced at full acquisition cost just to stand still. So when retention slips two points, you do not lose two points once. You lose two points of compounding premium, every year.
Put numbers on it. Take a $1,000,000 book and, to isolate retention, hold new business and rates flat. At 84 percent retention, five years later about $418,000 of that original book remains. At 95 percent, about $774,000 does, because the renewal rate compounds against the whole base every year. Same book, same market, a gap of more than $355,000 in year-five premium, which at a 12 percent commission is roughly $42,000 a year you keep or hand a competitor. For the playbook to move the number once measured, see our companion piece on how to stop policy churn. This post is about getting the measurement right first.
The three retention rates, and why they disagree
“Retention rate” is three numbers wearing the same name. Each answers a different question.
- Policy-count retention. Of the policies up for renewal, how many stayed? Heads, not dollars. The strictest of the three and usually the lowest, because a few large accounts cannot paper over many small losses.
- Premium (dollar) retention. Of the premium up for renewal, how much renewed? This counts money, so in a hard market rate increases push it up, and it can read above 100 percent even as client count falls.
- Household or PIF retention. Of your households (or policies-in-force per household), how many did you keep whole? This tells you whether cross-sell is holding, because a three-policy household is far stickier than a monoline one.
Run all three on the same book and you often see policy retention in the mid-80s, premium in the mid-90s, and household between. All three are correct. Quoting the flattering one to yourself is how agencies sleepwalk into a shrinking client base while the premium line looks healthy.
How to calculate policy-count retention
Start here, it is the hardest to fool. The formula:
Policy-count retention = (Policies up for renewal − Policies lost) ÷ Policies up for renewal × 100
Worked example. Say 250 personal auto policies came up for renewal in the trailing 12 months, and 31 canceled or non-renewed and did not come back, so 219 stayed. That is 219 ÷ 250, or 87.6 percent. Do it per line, or a strong commercial book will mask a bleeding auto book.
The hard part is defining “lost” honestly:
- Do not double-count a rewrite. If you moved a client from Carrier A to Carrier B at renewal to save them money, that is a kept client, not a lost policy plus a new one. Counting it both ways understates retention and overstates new business at once. Applied Epic’s retention guidance warns against a cancellation status on both terms.
- Separate controllable from uncontrollable losses. A client who died, sold the business, or moved out of state is gone, but not from anything you did. Track those apart so your controllable rate reflects your service, not your demographics.
- Decide how mid-term cancellations count. A policy that cancels three months in is a loss that will not show if you only look at renewal dates. Pick one method and keep it the same.
Failure mode: running the number once, agency-wide, at year end. The level tells you where you are; the trend, tracked monthly by line, tells you whether what you changed is working.
How to calculate premium (dollar) retention
Same structure, premium dollars instead of policy counts:
Premium retention = Renewed premium ÷ Expiring premium × 100
Worked example. You had $2,000,000 up for renewal, and policies representing $1,760,000 renewed. That is 88 percent. The twist is what happens when rates move.
Suppose those same policies renewed at an average 12 percent rate increase, so the renewing business now bills at about $1,971,000. Against the $2,000,000 that expired, premium retention reads roughly 98.6 percent, even though you lost the same clients. Push the increase higher, as carriers did in the hard market, and it sails past 100 percent. The number blends how many clients stayed and what rates did, and you cannot separate them from it.
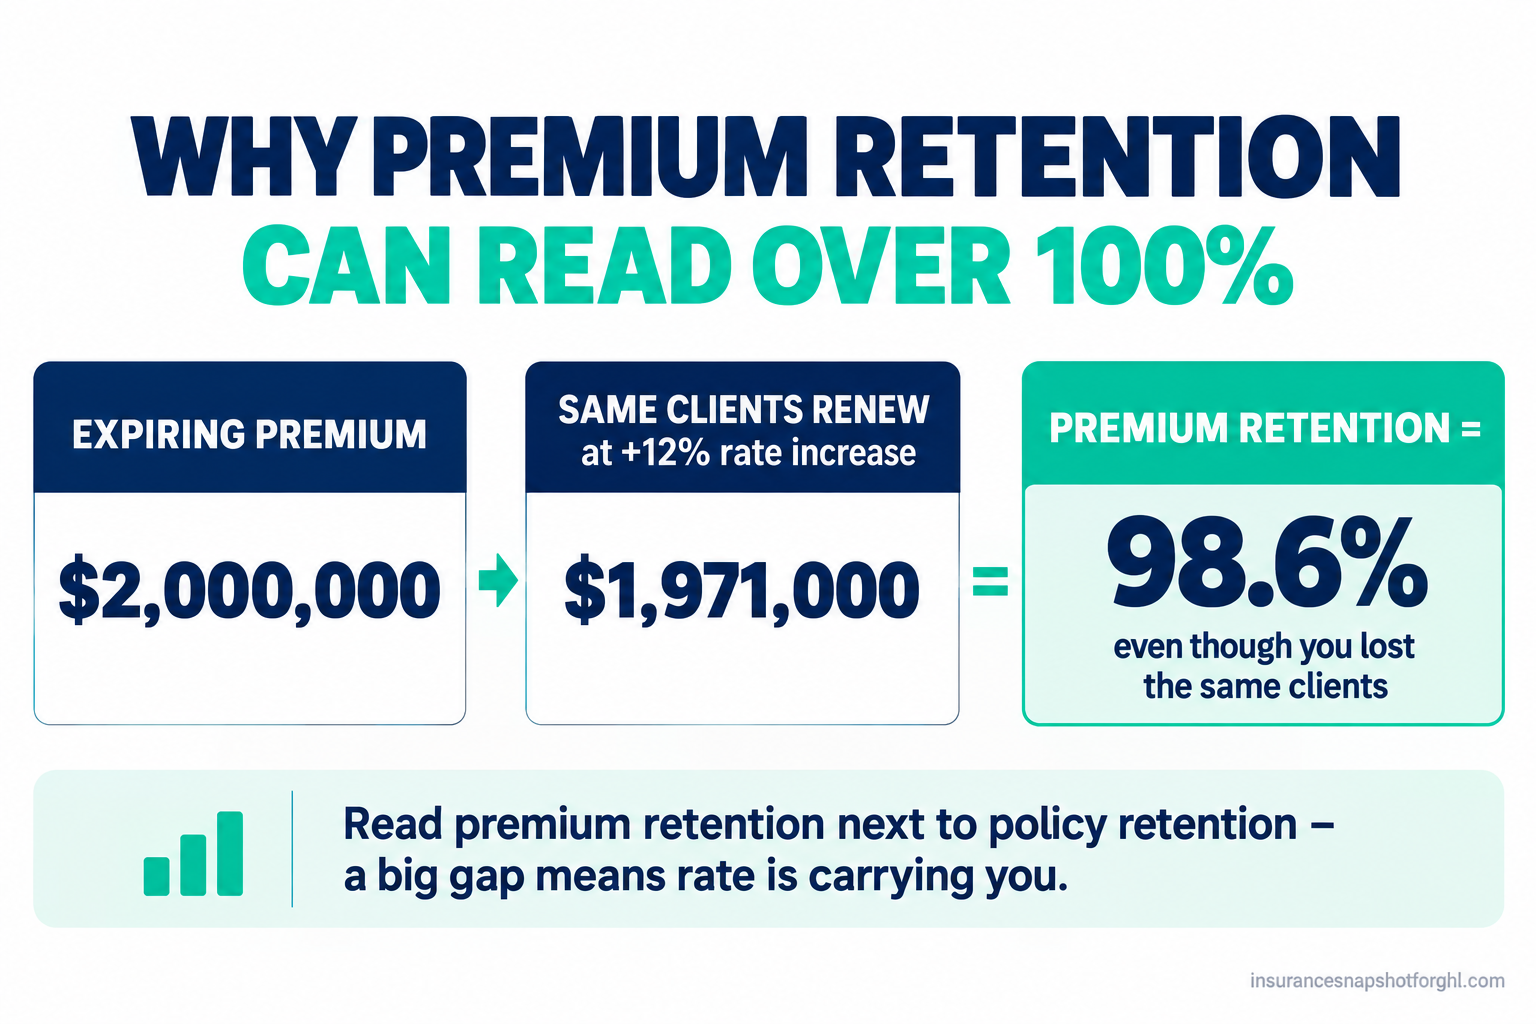
Failure mode: reporting premium retention without saying what rates did. Report it next to policy retention: a big gap means rate is carrying you and your client base is softer than the dollars suggest.
How to calculate household and PIF retention
Household retention asks whether you kept the whole relationship. The formula mirrors the others:
Household retention = Households retained ÷ Households at start of period × 100
A household is retained if it still has at least one active policy with you. A tighter version tracks policies-in-force per household (PIF), so you see whether it is still multi-line. A household that dropped from three policies to one technically “retained,” but it is one quote away from leaving.
This number predicts next year’s retention, because multi-line households are dramatically stickier than monoline ones, which is why carriers price bundles the way they do. If household retention is strong but PIF-per-household is falling, you have a cross-sell problem dressed up as a retention win. That is where your annual policy review process earns its keep: it catches the monoline household before it walks.
Failure mode: not tracking households at all because your AMS organizes by policy. You will celebrate keeping a client while quietly losing two of their three policies. Group by named insured, then measure.
Steal this: the 15-minute retention worksheet
You need only a renewal report and a spreadsheet. Copy this sequence.
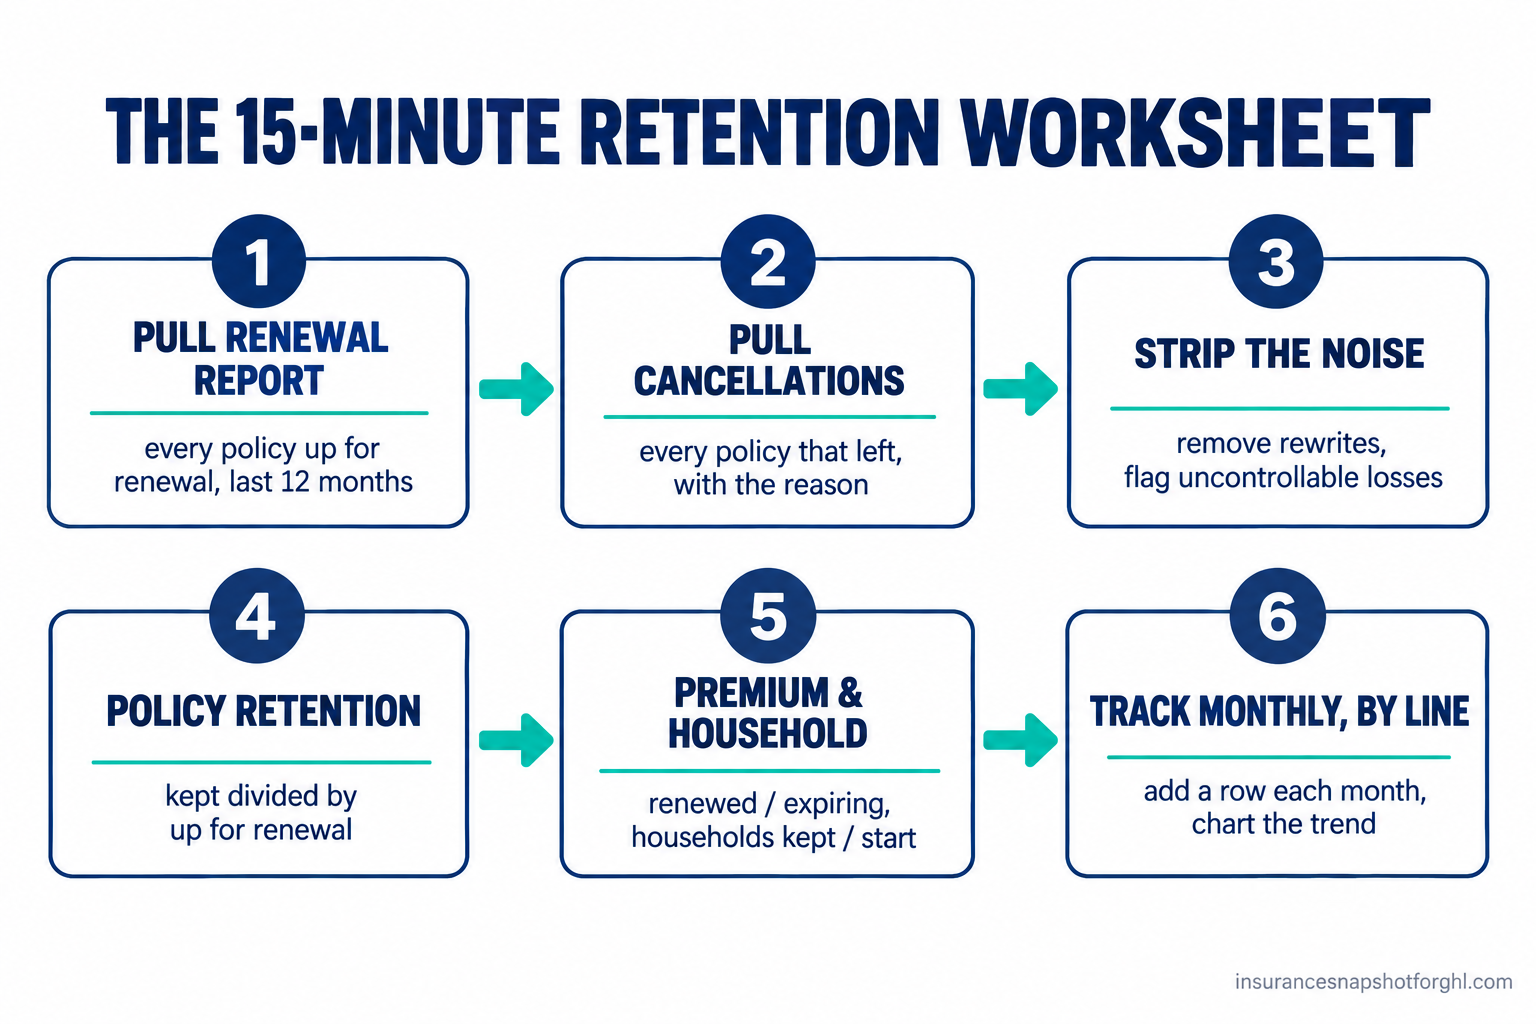
The 15-minute agency retention worksheet
- Pull a renewal report for the trailing 12 months. From Applied Epic, EZLynx, HawkSoft, NowCerts, or whatever you run, export every policy with a renewal date in the last 12 months, including carrier, line, premium, and named insured. (Shopping systems? We broke down what agency management software actually costs in 2026.)
- Pull a cancellation and non-renewal report for the same 12 months, with the reason where you have it.
- Strip out the noise. Remove rewrites (same client, new carrier, stayed with you). Flag deaths, business closures, and out-of-area moves as uncontrollable in their own column.
- Policy retention = (Policies up − Policies lost, controllable) ÷ Policies up. Once for the agency, then once per line.
- Premium retention = Premium renewed ÷ Premium expiring. Note your average rate change beside it, so the number has context.
- Household retention = Households still active ÷ Households at start. Add PIF-per-household now and again in 12 months.
- Write all three numbers, by line, dated, on one row of a running sheet. Next month, add a row. Within a quarter you have a trend, which is the only thing that tells you if what you are doing works.
Chart the three percentages and the whole team reads it at a glance.
The 2026 benchmarks: what good looks like
Here is where the industry sits.
Agency account retention benchmarks, percent. Industry average per Liberty Mutual’s 2026 Independent Agency Growth Study; top-agency range of 93 to 95 percent per Agency Performance Partners.
The average agency account retention rate hovers around 84 percent (IA Magazine on the Liberty Mutual study). Top agencies run 93 to 95 percent (Agency Performance Partners). Personal lines runs a touch below commercial, because auto shoppers are the most price-sensitive customers you have.
Two things to hold in mind. Benchmark by line, not against a blended figure, because a heavy auto book shows lower retention than a commercial-heavy one at the same service quality. And the trend beats the level: since only 18 percent of agencies improved retention 5 percent in a year, simply moving the number puts you ahead of most of the field. For the wider set of agency numbers, see our 2026 insurance agency statistics roundup.
Solo, five-producer, and larger: how to measure each
The formulas do not change with size. What changes is how you run them and what breaks.
The solo agent. You are the retention process. You probably do not have clean reason codes yet, so your controllable-versus-uncontrollable split will be rough at first. Do not let that stop you. Run policy and premium retention agency-wide each month and keep the by-name loss list by hand. You know these clients personally, so your ten calls a quarter are genuinely diagnostic. The failure mode is skipping measurement because it feels like overhead when it is just you.
The five-producer agency. Retention is now a management number. Measure it by producer as well as by line, because a book-wide 88 percent can hide one producer at 95 and another at 78. That is a coaching tool: the 78 producer is usually missing a specific step, like the pre-renewal call on rate increases. This is the size where a shared renewal cadence stops retention from depending on which producer happens to be organized.
The larger agency. The problem flips from measuring to trusting the measurement. Across multiple locations and systems, your report is only as good as your data hygiene, and rewrites and mid-term moves get miscounted at scale. Invest in clean reason codes and one rewrite rule across the team, and audit against a hand-pulled sample each quarter. The failure mode is a beautiful dashboard built on dirty inputs.
Where measuring retention touches compliance
Measuring retention is just arithmetic. The compliance questions live in what you do next, in how you chase and win back the clients it flags. Three guardrails:
- Retention outreach is still outreach. The texts and calls you fire at a lapsing client run under the same rules as any marketing contact: prior express consent for autodialed or texted marketing, honor STOP immediately, and respect calling-time rules under the TCPA as the FTC and FCC apply it. Do not write your policy around the FCC’s one-to-one consent rule, which the Eleventh Circuit vacated in January 2025. Our TCPA field guide covers the mechanics.
- Win-back gifts hit anti-rebating limits. A gift card to keep or reclaim a client runs into your state’s anti-rebating law, where caps are low and vary, from as little as $25 to $100 per client per year. Check your state department of insurance first.
- Retention numbers in your marketing must be true. If you advertise “95 percent retention,” be ready to show the calculation, and if you sell life or annuities, advertising rules under the NAIC model require accuracy and specific disclosures.
Objections
“My AMS already gives me a retention number, so why do this by hand?” Because you do not know which of the three it is giving you, how it treats rewrites, or whether it counts mid-term cancellations, until you build it once yourself. Run the worksheet and compare. If they match, you now trust the dashboard. If not, you just learned your reported retention was wrong.
“Retention is out of my hands. Carriers are non-renewing whole books.” Some of it genuinely is, which is why you separate controllable from uncontrollable losses. Carrier-driven non-renewals go in the uncontrollable column; your controllable rate is the one you can coach. Measuring the split stops you blaming the market for a missed renewal call.
“We’re at 84 percent, which is average, so we’re fine.” Average is the middle of a field where most agencies are not moving. The gap between 84 and the 93-to-95 percent top agencies run is enormous compounded over five years. Average is not a resting place; it is the number you beat.
“We’re too small to bother tracking this.” Smaller books are more fragile, not less. Losing ten clients off a 400-client book is a 2.5 percent hit, and the smallest shops have the least cushion when a block walks.
What to do with the number once you have it
A retention rate is a diagnosis, not a treatment. Once you can say all three numbers by line, by producer, and as a trend, attack the controllable losses: tighten the pre-renewal call on rate increases, run a real annual review, and make sure no renewal depends on whether a producer remembered to follow up. That is a system you build once and run every month.
So the next time someone asks “what’s your retention,” you will not round from memory. You will have three numbers by line, you will know which one you are saying and why, and you will have the worksheet that backs it. That is the difference between the agencies leaking renewals out the back and the ones quietly compounding their book.
FAQ
What is a good retention rate for an insurance agency in 2026?
The average agency account retention rate sits around 84 percent, and top-performing agencies run 93 to 95 percent (Liberty Mutual's 2026 Independent Agency Growth Study and Agency Performance Partners). Personal lines usually runs a few points below commercial. Benchmark yourself by line, not against a blended average, and watch the trend: an agency at 86 percent and climbing beats one at 90 and sliding.
How do I calculate my agency's retention rate?
Start with policy-count retention: policies up for renewal in the last 12 months, minus the ones you lost for controllable reasons, divided by policies up for renewal. For example, 219 kept out of 250 is 87.6 percent. Then run premium retention (renewed premium divided by expiring premium) and household retention (households still active divided by households at the start). Do each by line of business.
What's the difference between policy retention and premium retention?
Policy-count retention measures how many customers stayed; premium retention measures how many dollars stayed. They disagree because rate changes move premium but not client count. In a hard market, rate increases can push premium retention above 100 percent even while you lose clients, so it can hide a shrinking base. Read the two side by side, and note your average rate change next to the premium figure.
Can premium retention really be over 100 percent?
Yes. If the premium on renewed policies, after rate increases, is higher than the premium that expired, premium retention reads above 100 percent. It happened to many agencies in the recent hard market. It is not an error, but it is a warning that rate is carrying the number and your client and household retention may be softer than the dollars suggest.
Should I count a policy I rewrote with a different carrier as a loss?
No. If the client stayed with your agency but moved carriers at renewal, that is a retained client, not a lost policy plus a new one. Counting it as a loss understates retention and overstates new business at the same time. Define one rewrite rule and apply it consistently, and never put a cancellation status on both the expiring and renewing policy. Measure monthly, by line, so you build a trend rather than a single annual number.